
This page last updated on Friday, October 13, 2006 at 9:45:58 AM
| Home | | ATV | | ATV Centre | | Schools | | Fenton Relay | | Antenna Theory | | Other Pages |
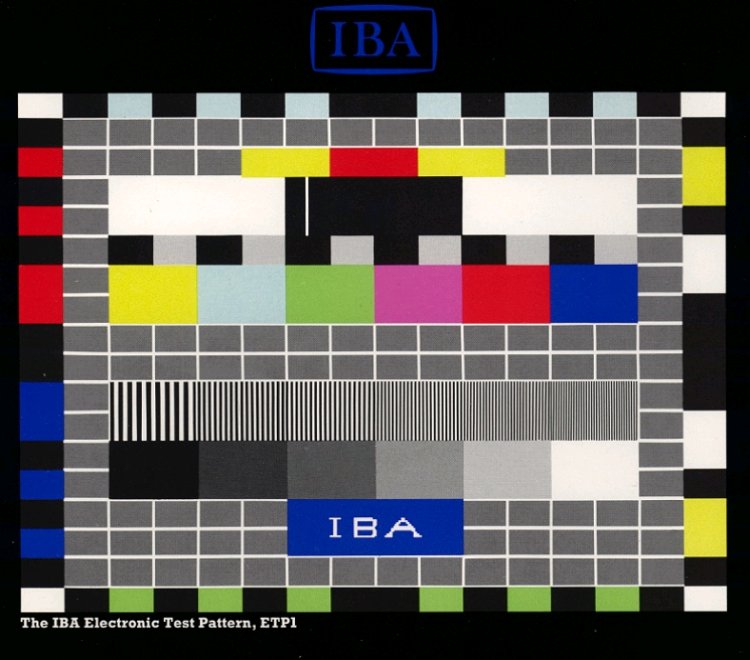
Electronic Test Pattern 1 (ETP1)
This is part of an IBA leaflet, released in September 1979, for distribution to engineers.
| ETP1 | ||||||||||||||
|
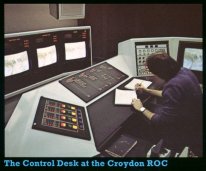
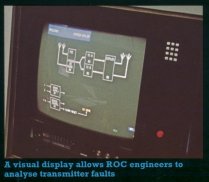
The IBA's Electronic Test Pattern, ETP1, is now being transmitted in some ITV regions when programme schedules permit. Up-to-date information on these test transmissions can be obtained from the Engineering Information Service of the IBA. This leaflet explains the important features of this test pattern. The need for an electronically generated test pattern has arisen because the IBA is bringing into service four Regional Operations Centres (ROCs). Over the next few years, these will replace the 14 IBA Control Centres originally built to monitor and control the ITV UHF colour television service. Trade transmissions from the original control centres currently consist of a combination of standard European Broadcasting Union (EBU) colour bars and Test Card F. Test Card F is originated from a 35mm colour slide ; and the equipment needed to play-out the slide needs regular adjustment. The advent of the new ROCs allows us to introduce a test-card system which needs no maintenance. An electronically generated test pattern, when once installed, requires no adjustment at all, while affording the further advantages of consistency and reliability. The electronically generated test pattern will ultimately replace the use of Test Card F in all IBA transmissions. The test pattern provides all the basic features necessary for receiver alignment, and it can be used for overall assessment of picture quality as, for example, when installing a TV aerial. Features of the IBA test pattern include : 1. Crosshatch pattern - for convergence check. This may best be seen with the colour control turned down to give a monochrome picture. So far as possible, the white grid should be free from colour fringing. In practice, most receivers tend to give some slight fringing, particularly near the edges of the picture. 2. EBU colour bars (75% amplitude, 100% saturation).
4. Multiburst - for bandwidth /resolution check. Six sets of sine-wave gratings corresponding to the following frequencies (MHz):
It is normal for a colour receiver to exhibit a bluish-yellow pattern (known as 'cross-colour') on the 4.5 MHz grating ; and also, to a lesser extent, on the 4.0 MHz and 5.25 MHz gratings. Because of a special filter incorporated in colour receivers, which prevents the colour sub-carrier from appearing on the screen, the 4.5 MHz bars are likely to be indistinct. Also, they are likely to be indistinct on most 405-line monochrome receivers. 5. 150 kHz squarewaves - for transient response check. Just above the colour bar there is a train of 150 kHz squarewaves (0 % and 75 % amplitude). This is to facilitate a check on any ringing, overshoot or preshoot. Ideally, there should be sharp transitions between the black and white rectangles, without `smudging'. The transmitted transitions are as fast as the UK 625-line standard permits. 6. Black rectangle within white rectangle - for low frequency response check. Low frequency response can be assessed by the appearance of the black rectangle within the white rectangle near the top of the pattern. Poor low frequency response shows as streaking at the right-hand edges of these rectangles, and from the border castellations. 7. White needle pulse - for reflections check. Any reflections of the television signal, from hills or large buildings, can result in displaced `ghost' images. The effects of short-term reflections are revealed by secondary images of the white needle pulse within the black rectangle. 8. Yellow-red-yellow rectangles-for chrominance/ luminance delay check. The redness of the rectangle near the top of the pattern should fit snugly between the yellow rectangles. 9. Line synchronization castellations - the left, right and bottom borders are formed by a pattern of alternate rectangles in black and colours with high luminance value and with a white rectangle in each corner. On monochrome receivers these rectangles appear either as black or as various lighter tones ranging from grey to white. The right-hand side border serves as a test signal for checking the line synchronization of receivers - faulty line synchronization shows as horizontal displacement of those parts of the picture on the same lines as the lighter toned rectangles on this side. These castellations, being yellow and white, provide a check on sync separator performance in the presence and absence (in 625-line transmissions) of the colour sub-carrier. The spacing of the left-hand and right-hand castellations has been staggered to identify the side from which any disturbance arises. 10. Colour receiver reference oscillator castellations. The coloured border castellations can be used in checking for correct decoding; top : cyan, bottom: green, left-hand side : red and blue, right-hand side : yellow.
EIS 120 9/79 |
;)
;)